|
Breaking News...The Earth is Warming... Still. A LOT
Posted on 16 March 2012 by Glenn Tamblyn
In a previous post we discussed how the argument that the Earth has stopped warming doesn't make much sense because the people claiming this don't know how to draw their 'system boundaries' correctly - how can you work out whether the Earth is warming if you don't take account of all the places where it may be warming? And most commentary seems to only focus on surface temperatures. Which is only 3% of the Total Heat Content change.
So in this follow-on we would like to try and convey this warming from all the parts of the climate system in terms that we can all grasp. Grasp at an imaginative and visceral level. Because numbers, no matter how accurate, can be rather dry and hard to digest.
Do the math, Follow the heat....
Previously we showed the following diagram from the IPCC's 2007 AR4 report, highlighting the warming of the atmosphere and how small it was compared to the total warming.
Now we would like to focus on the total figure at the bottom and try to convert that into numbers that we can all get our heads around. To try and make numbers with lots of zeroes meaningful.
The total heat accumulation in the environment from 1961 to 2003 is estimated as 15.9 x 10²² Joules. Got that? Is that clear in your head? Now read on...
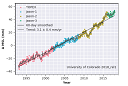
Next, this graph from the National Oceanographic Data Centre, looking at Ocean Heat Content in the upper half of the ocean shows the following:
Roughly 5 x 10²² Joules since 2003. Since the IPCC's graph above up to 2003 shows that most of the energy from global warming is in the oceans, to a first approximation, Ocean Heat Content change since then is going to be close enough to the Total Heat Content change.
So, total heat content change from 1961 to 2011 - 50 years - is approximately 21 x 1022 joules.
210000000000000000000000 joules
(a joule is 1 watt for 1 second. So a 100 watt light bulb will use 100 joules in 1 second)
A BIG number but somewhat unreal. So how much heat is this. What could it do? What is it in the real world, where we don't routinely look at numbers that big.
That is HOW Big...?
This is a rate of heating of 133 Terrawatts. Or 0.261 Watts/m2.
133 Terrawatts is 2 Hiroshima bombs a second. Continually since 1961." (Now, that is a lot of AGW!!)
More:
"States, setting a mountain of new records
By Janet Raloff
Web edition : Tuesday, April 10th, 2012
People may argue about why Earth is warming, how long its fever will last and whether any of this warrants immediate corrective action. But whether Earth is warming is no longer open to debate. The National Oceanic and Atmospheric Administration has just published domestic examples to reinforce what Americans witnessed last month — either on TV or in their own backyards.
Let's start with the heat: March 2012 temperatures averaged 10.6° Celsius (51° Fahrenheit) — or 5.5 °C warmer than the 20th century average across the contiguous United States. Throughout the more than 115 years that national U.S. weather data have been compiled, only one other month (January 2006) surpassed this past March in its departure from the average.
In all, U.S. weather stations logged almost 15,300 all-time highs, last month, roughly half of them for nighttime temps. “There were 21 instances of the nighttime temperatures being as warm, or warmer, than the existing record daytime temperature for a given date,” NOAA’s new analysis finds. Only Alaska bucked the trend; its temperatures were the tenth coolest for March.
Nor was last month the only anomalous period. The first three months of 2012 also set a record for toastiness across the contiguous United States, with an average temperature throughout the period of some 5.6 degrees above the long-term average. Sixteen states had temperatures ranking among their 10 warmest for the quarter. None of the contiguous states posted a quarterly composite for January through March that fell below its long-term average.
In many regions, March weather anomalies sparked conversations. At the Society of Toxicology meeting in San Francisco, for instance, I ran into three researchers who remarked on needing sweaters. All said it was warmer at home than at the meeting — home being Michigan, Maine and Indiana. In the DC area, people ogled earlier-than-normal blooms in their yards and on century-old cherry trees lining the Tidal Basin.
Nationally, the entire 2011-to-2012 cold season (October through March) proved especially mild. It was the second-warmest on record across the 48 states.
Accompanying the heat came a diminished rainfall. Nationally, the 2012 precipitation average is somewhat more than 0.7 centimeters (0.29 inches) below average. As of last week, one-third of the lower 48 states were experiencing drought — up from 18.8 percent this time last year.
The heat stirred up weather systems, driving plenty of big storms. March 2012 saw more than 220 tornadoes — or almost 2.8 times the long-term average for that month. One particularly severe spell on March 2-3 caused 40 deaths and racked up an estimated $1.5 billion in commercial and property losses.
The “Climate Extremes Index” — a scale introduced 16 years ago — attempts to quantify trends in extreme weather by identifying the percent of the contiguous states that fall outside the norm of temperature, precipitation, severe drought and hurricanes (or tropical storms) making landfall. So far, the 2012 index rating is 39 percent, or about twice the expected value.
Weather records are just one quantifiable measure of warming. Many others can be harder to eyeball. For instance, the annual mean sea surface temperature for last year was the 9th warmest for the period that started in 1880. (The 10 warmest years have all occurred since January 2000.)
We reported a wealth of analyses last year pointing to the Arctic having evolved “to a new normal,” with warmer, drier weather. Last July, researchers announced that relatively deep coastal waters off Greenland are now expected to warm considerably faster than elsewhere by the year 2100, exaggerating the risk of ice sheet melting and global sea-level rise.
Many people won't complain about a somewhat balmier winter or marginally early spring. But warming isn't a cold-weather phenomenon. It's a 24/7 event occurring year-round. And at least here in the nation's capital, an increase in the normal summer-long muggy heat is not something I can imagine anyone welcoming."
_________________
"With every decision, think seven generations ahead of the consequences of your actions" Ute rule of life.
“We do not inherit the earth from our ancestors; we borrow it from our children”― Chief Seattle
“Those Who Have the Privilege to Know Have the Duty to Act”…Albert Einstein
Last edited by Johhny Electriglide on Mon Apr 16, 2012 1:57 pm, edited 1 time in total.
|