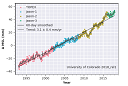
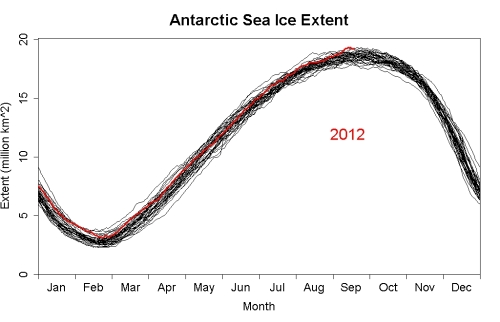
I think it's interesting that the Antarctic Sea Ice tied with 2007 for the highest ice extent ever recorded when 2012 reached a record low on the Arctic.
I think that the two may be connected.
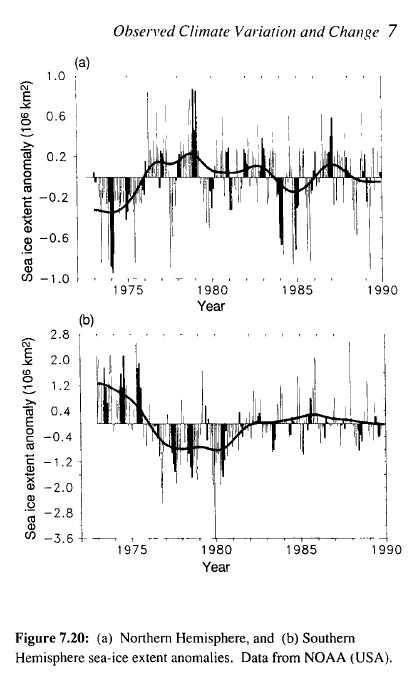
Take a look at this graphic from back in 1990.
Notice that when the Northern Hemisphere had a low Sea Ice Extent back in 1975, the Southern Hemisphere was at record highs. The Northern Hemispheric Sea Ice then increased while the Southern Hemispheric Sea Ice declined sharply. The Southern Hemispheric Sea Ice then gradually increased ever since, and the Northern Hemisphere decreased ever since.
The two variables changed dramatically during a short time, an indicator of a non-linear system changing from one state to another. The change in Sea Ice at the poles occured roughly during the time the PDO switched from it's negative to positive state, suggesting that the PDO plays a role in the Arctic Sea Ice melt and Antarctic Sea Ice growth. Oceanic Currents may explain 51% of the variation, as the r^2 value for the two variables (Arctic and Antarctic Sea Ice Extent Anomalies since 1979) is -0.51.
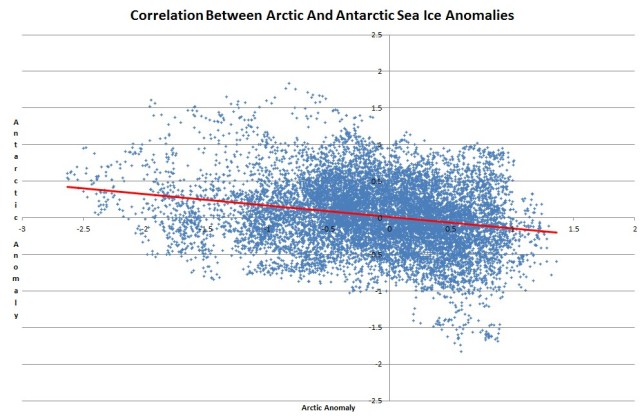
The chart above comes from Steven Goddard. NEVER have I praised Steven Goddard. I think that he is a lying, deceptive, and manipulative individual. However, the calculated correlations are definitely interesting, and indicate a moderate correlation does exist with the poles.
The data for the Arctic and Antarctic Sea Ice Extent Anomalies that he used in the above graph can be viewed and respectively.