The proposed mechanism for increased amounts of the sun's geomagnetic activity having an impact on the Earth's Climate is quite complicated, since there are many ways in which the sun can impact the climate.
One of the most famous ways is with the reduction in Cosmic Rays reaching Earth. The reduction in Cosmic Rays creates fewer Low Clouds, and since Low Clouds have an overall cooling impact, a decrease in these clouds would lead to a warming impact. Why does increased geomagnetic activity create lower amounts of Cosmic Rays? Because of higher amounts of Solar Wind preventing the Cosmic Rays from reaching Earth.
Indeed, there are strong correlations between temperature and various solar output variables.
Georgieva et. al 2005 used the Geomagnetic AA Index to quantify the solar impact on Climate Change, rather than the sunspot number, because using the sunspot number to quantify the solar contribution to climate change, as many studies do, leads to an underestimation of the Solar impact on Climate Change.
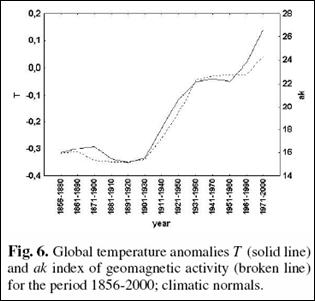
The above figure from Georgieva et. al shows the Geomagentic AA Index with the broken line, and the Global Temperature Anomalies with the solid line. They find that the correlation coefficient between the AA Index and Global Temperatures is 0.85, meaning that the sun can explain 85% of the variances in temperatures over the last ~150 years.
Cliver et. al 1998 also used the Geomagnetic AA Index to estimate the solar contribution to climate change.
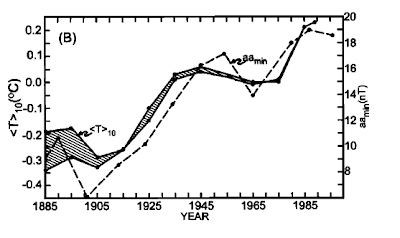
Above figure: From Cliver et. al 1998. The AA Index is the dotted line, and the solid line are the temperature anomalies.
They found that 50-100% of the warming could be due to the sun, but it should be noted that this analysis does not include other factors like volcanic activity and anthropogenic greenhouse gas emissions when estimating the total contribution. Nonetheless, this study also shows that other studies which do include these factors are only at the lower end of the 50-100% range for the solar contribution over the last 100-150 years. It also supports other studies with a larger solar contribution to climate change because of the remarkable correlation with the AA Index and temperatures.
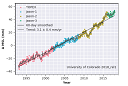
Scafetta and West 2008 adresses the uncertainty raised in the first paper. If a TSI curve that shows an upward trend from Solar Cycle 21 to 22 is used from the ACRIM TSI composite rather than the flat PMOD TSI composite, then a higher contribution from the sun would be needed. The authors find that up to 69% of the variances in temperatures can be explained by solar activity.
The image above from Scafetta and West 2008 shows the divergence between the PMOD and ACRIM TSI datasets, which makes attribution to past climate change even harder. The red curve is the ACRIM TSI composite, the blue curve is the PMOD TSI Composite, and the black curve and green line are the Global Temperature anomalies.
The ACRIM verses PMOD controversy continues in this paper. 50% or more of temperatures can be attributed to the solar forcing, depending if the ACRIM TSI composite is used or not. This further adds on to resolving the uncertainty between the PMOD and ACRIM datasets during the ACRIM Gap.
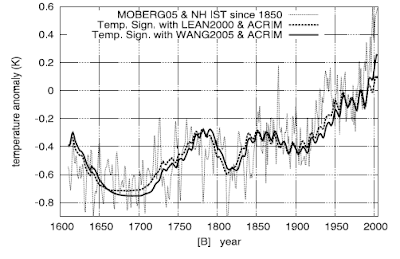
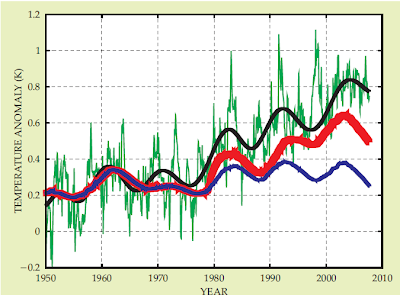
The graph above from Scafetta and West 2007 shows the excellent correlation between solar activity and temperatures. It also shows that a large portion of the warming can be attributed to solar activity. Over the last 30 years, a significant portion of the warming can be attributed to solar activity if the ACRIM TSI composite is used.
Ogurstov 2007 estimated that the solar contribution directly and indirectly caused about 0.25-0.35 degrees C of the warming that took place during the 20th Century. Using the Skeptical Science trend calculator gives an approxiate warming of 0.6 Degrees C during the 20th Century. This means that 41-59% of the trend upward can be attributed to solar activity over the past 100 years.
Blanter et. al 2008 found that temperatures correlated remarkably well for all periods between the solar activity indicies and the observed temperatures for stations in Europe and the United States during the 20th Century. They used a finding from a previous study that the temperatures at weather stations correlated remarkably well if they were up to a 1000 km distance from each other. They also state in the abstract that these changes can "possibly" be extended onto a Global scale.
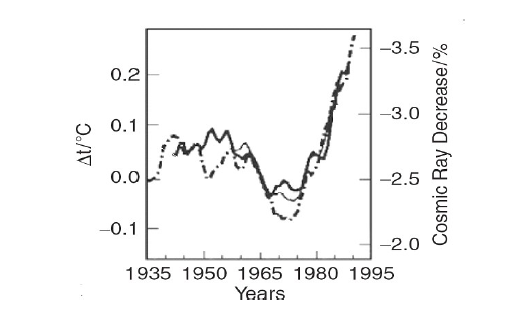
This figure from above combines the global temperature anomalies to the Cosmic Ray Flux (CRF) from 1937-1994. There is a very good correspondance between the two variables, suggesting that Cosmic Rays (modulated by solar activity) play a large and dominant role in current climate change.
So there appears to be a VERY strong relationship between various solar parameters and temperatures over the last 100 years! Does this imply that Cosmic Rays are the cause of climate change. Not quite, since correlation does not imply causation, but there is a large range of evidence that suggests that Cosmic Rays have a large impact on the atmospheric parameters.
(who was also one of the authors in the CERN paper) et. al found that during large Forbush Decreases, there are precipitation decreases observed, suggesting that this is a cause from a sudden decrease in Cloud Cover.
found that with Forbush Decreases exceeding a GCR decrease of 7%, a noticeable increase with the DTR was observed. This can only be explained through cloud cover decreases, since clouds reduce the DTR range, and a decrease in cloud cover would create an increase in the Diurnal Temperature Range.
 This paper evaluates whether there is empirical evidence to support the hypothesis that solar variability is linked to the Earth's climate through the modulation of atmospheric precipitation processes. Using global data from 1979–1999, we find evidence of a statistically strong relationship between cosmic ray flux (CRF), precipitation (P) and precipitation efficiency (PE) over ocean surfaces at mid to high latitudes. Both P and PE are shown to vary by 7–9% during the solar cycle of the 1980s over the latitude band 45–90°S. Alternative explanations of the variation in these atmospheric parameters by changes in tropospheric aerosol content and ENSO show poorer statistical relationships with P and PE. Variations in P and PE potentially caused by changes in CRF have implications for the understanding of cloud and water vapour feedbacks.]Kniveton and Todd 2001
used 17 Forbush Decreases (large and sudden decreases in Cosmic Rays after a Coronal Mass Ejection) after 1998 (since this is when AERONET started) that were above a 7% decrease, and compared these changes in GCRs to corresponding changes in aerosol particles. Aerosoles are the "seeds" to cloud formation. Without these, water vapor droplets would not be able to condense onto a physical substance to form a cloud. Svensmark et. al found that for each FD event analyzed, a sudden decrease in aerosoles was also observed. This indicates a significant GCR impact on the atmospheric composition.
Regardless of if it is Cosmic Rays or not, CMC, (though there is much evidence for a GCR-climate connection), an amplifying mechanism is needed for the sun-climate connection.
Over the 11-year solar cycle, small changes in the total solar irradiance (TSI) give rise
to small variations in the global energy budget. It was suggested, however, that different
mechanisms could amplify solar activity variations to give large climatic effects, a
possibility which is still a subject of debate. With this in mind, we use the oceans as
a calorimeter to measure the radiative forcing variations associated with the solar cycle.
This is achieved through the study of three independent records, the net heat flux
into the oceans over 5 decades, the sea level change rate based on tide gauge records over
the 20th century, and the sea surface temperature variations. Each of the records can
be used to consistently derive the same oceanic heat flux. We find that the total radiative
forcing associated with solar cycles variations is about 5 to 7 times larger than just
those associated with the TSI variations, thus implying the necessary existence of an amplification
mechanism, though without pointing to which one. There are many more papers than this documenting a strong solar influence on the climate, I just wanted to give a snapshot of the various pieces of evidence for solar driven climate change floating around in the scientific literature.